
I’ve mentioned story cards, points, iterations, and burn down charts, but I’ve never explained it here on this blog. Unless you’ve done similar Agile project planning, you might not know exactly what I’m talking about. Thanks to Erik Yuzwa and Casey Dunham for asking me to explain my project planning process!
In traditional waterfall development, Big Design Up Front (BDUF) is the rule. BDUF is done on the belief that if you plan every detail early and hand off the design to the development team, the development should be smooth sailing. The reality is that requirements evolve, technical requirements might not be fully understood at first, and not everything can be anticipated. Agile software development practices are an attempt to work within the true nature of development to deliver working software to the customer. Things change, so make sure your methods make it easy to change.
In a project, you have stakeholders and developers. Stakeholders are usually game designers, product managers, project managers, CEOs, customers, or anyone who has input into the direction a project should take. Developers are the ones who put the project together to the satisfaction of the stakeholders. Stakeholders know best about what the project’s priorities are and can determine the value of the finished project and feature set. Developers know best about how long specific tasks might take or how difficult features might be to implement. During the planning phase of an Agile project, the two groups work together to figure out a prioritized feature set and estimated schedule.
I’ll start by warning you now. I’m not an expert. I have very little knowledge and experience with project management and the role of a game producer. What I’ve done is based on my experience as a cube dweller at my last day job. The company was pursuing Agile development methodologies, and I got some training as a developer, and I was able to see how the stakeholders were trained as well. To make it worse, I work alone, so I have to put in extra effort to wear the hats of business owner, project manager, and other stakeholders. Sometimes I took shortcuts, but only because there’s no need to communicate with myself explicitly.
If you’re a fan of Joel on Software, you might find the article on Evidence-based Schedules more helpful. Instead of settling on an arbitrary date, it gives you a confidence distribution curve over a range of ship dates, which gets more accurate as the project progresses.
When you have a specific date as a hard deadline you can’t miss (hahaha), the following explanation of an instance of Agile project planning might help.
Introduction to Paddles of War
Let’s assume you’ve green-lit a project and have picked a date for when you would like to see it finished. I’ll illustrate with a simple example called Paddles of War. It’s based off of a game I tried to implement in college in QBasic. It was inspired by an Atari 2600 game I loved called Warlords.
Paddles Of War is a multiplayer, real-time battle game. Each player controls a paddle, defending a castle made up of walls and the king behind them. A cannon ball is ricocheting around the play area, and each time it hits one of the castle walls, it destroys that part of the wall, eventually exposing the king behind it. If the cannon ball hits the king, the king is killed and the associated player is eliminated from the game. The last player with a surviving king is the winner. If the cannon ball hits the paddle, it is deflected away.
A fairly simple game, it’s like Pong meets Arkanoid with some battle elements thrown in. Let’s say that the deadline for the project is three months from now.
Stock Up On Supplies
First, you’ll need some tools. To start, when you’re in the project planning stages, you’ll need a lot of index cards and something to write with. Sharpie markers are usually suggested, but pens are fine. I also like having different colored index cards to help with visually differentiating between different kinds of cards. I’ll get to specifics later in this article.
During a project, you should be able to look at a wall of index cards and know at a quick glance what is currently being worked upon, what is scheduled for the current iteration, what’s finished, and what’s blocked. I purchased two cork boards and put them side-by-side. Why not one large cork board? Well, it was more expensive and I’m an indie on a budget. Also, with two boards, I could rearrange and separate them at will, so it seemed more flexible. I also have pins to put index cards up on the boards.
And that’s it. All you need to do this kind of Agile project planning is a writing utensil, a bunch of index cards, and a place to post them. I suppose sticky notes might work, but I’d worry that the paper would curl and the glue would stop working. Pins and index cards seem to work great.
You can also make use of a spreadsheet to create a chart to make progress easier to track, and I find such charts really useful for project health checkups. I’ll explain how I use Google Docs for such charts, but you won’t need to worry about it until the project starts.
Identifying the Project Requirements
Now you are in what is known as Iteration Zero. Agile project scheduling is based on iterations, and iterations are an arbitrary unit of time. Usually, a week is good, although some projects will have two or three week iterations.
Iteration Zero is the time to identify the work required for the project and figure out what the implicit and hidden requirements are. Find a room with a large table (or use the floor if your pets will leave you alone long enough), and bring the index cards and writing utensils.
At this time, everyone can create what are called User Stories. See this introduction to user stories for more details, but you can think of it as a high level, basic description of a feature or requirement. Some people argue that only stakeholders can create user stories, but developers might be more familiar with the underlying requirements. If your publisher has standards for what should be in every single game, such as translations to other languages or configuration options, the game designer might not necessarily be aware of their existence, yet the developers still have to expend the effort to get them done.
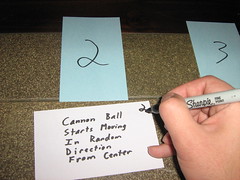
When creating a user story, you want it to be easy to identify what the story is, which requires a minimum number of words and big writing:

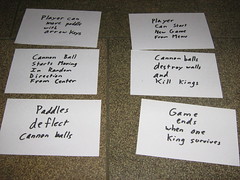
As you can see, each story card is very easy to read from a distance, assuming you write them legibly.
In the case of Paddles of War, the game designer might come up with these initial stories:
- The player can start a new game from the menu.
- The player can move the paddle with arrow keys.
- The cannon ball starts moving from center in random direction.
- The cannon ball can destroy castle walls and kill kings
- Paddles can deflect the cannon ball.
- Game ends when there is only one king left.
There will be many, many more, but with just these high-level stories, it’s enough to start thinking about the software needs. A developer might wonder if these stories say everything accurately and poses the question: “Is it possible for there to be more than one cannon ball in play?”
The designer might respond, “Oh, that’s a good idea! Multi-ball might be fun!”
Before the designer creates a new story card about allowing multiple balls in play, the developer points out that with more than one ball, there’s the potential for two kings to be killed simultaneously, which means it is possible that there will be no more kings left. Since the game ends when there is only one king left, what happens when there isn’t one? Are draw games allowed, or should there always be a victor? How does the designer want to handle this situation?
While the programmer can provide input into this story, it’s ultimately the designer’s call if it should be one. The designer is the stakeholder, and he/she is the one who determines the value of features and whether they should exist in the first place.
The programmers might see ricocheting cannon balls and collision responses, and they’ll recognize the need for a physics system. Is there an in-house system available? Do they have to build it themselves? Will they use a third-party solution?
No matter what the answer, the important thing is that questions are being asked. Stakeholders and developers are communicating about what the project will actually be. The producer might have to look into existing solutions, but maybe there isn’t much of a budget for such things. For now, a story can be written related to the creation of a physics system. An implicit requirement is now explicit.
When you’re finished with user story creation, you might have many tens or hundreds of cards, depending on the complexity of the project. For my Ludum Dare 18 version of Stop That Hero!, for instance, I had 31 cards in the end, and I’m sure I remember that some important aspects of the game had no story cards associated, so there could have been more. Since the game was being done in a weekend, I didn’t bother creating the story cards towards the end to reflect to newly identified work. Since I was working on my own, it’s not like I had to stop and communicate my intentions to anyone but myself, so I took a shortcut. When you work with someone else, you’re not going to be able to do the same without repercussions.
Now, by figuring out all of these stories, aren’t we doing the same thing as Big Design Up Front, which means it has all of the rigidity disadvantages as well? No. Agile Development is meant to respond to change, but you can’t respond to change if you don’t know what the change is from. By trying to identify all of the stories that make up the project, you have a good, high-level idea of what the project actually looks like. Also, you save time. The details for any given story can be planned when that story is being worked upon, so lower-level details benefit from a kind of a “Just-in-Time” planning. After all, if the project is likely to change, the stakeholders might decide that a particular story doesn’t need to be implemented at all. By waiting to plan the details until you actually work on it, you aren’t wasting time on making plans that never needed to be carried out.
Estimating Cost
Now that the user stories are finished, it’s time to estimate how much effort will be required for each story. Now, remember, the developers are the only ones who can make estimates with any accuracy. Implementing stories is their domain. Stakeholders can question estimates or ask for explanations, but in the end, if a developer thinks that a story is going to be tricky, the stakeholders have to accept that estimate.
To do estimates, each story card is given a numerical score. This score doesn’t necessarily correlate with a time estimate, although some teams like to think that a number represents the number of hours or days it would take to accomplish anything. The point of the numerical score is to indicate the estimated cost of a story, whether in time or effort. Also, this estimate will be different depending on who is doing the estimation. A veteran game developer is going to create more low scores than a junior developer would. The team of developers must agree on the score for each card.
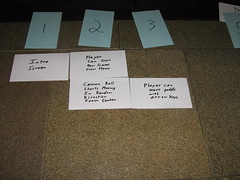
This is the part that could be incredibly time-consuming, but a nice way to speed it up is to take all of the story cards and throw them into separate collections: easy, medium, and hard. Then for each collection, you can probably quickly separate them into sub-collections of easy, medium, and hard, or maybe just easy and harder, or whatever the developers find appropriate. Boom. You’re done. Now you just have to write down numbers on the cards corresponding to what collection and sub-collection they’re in, and you’re done assigning story points. To illustrate:
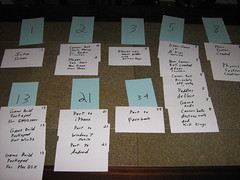
Separating the cards into columns by expected relative difficulty from left to right:
Assigning numbers to the columns:
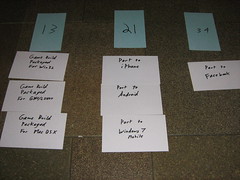
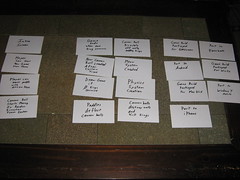
Putting the score on the story cards in the upper right hand corner:
The entire project at a glance:
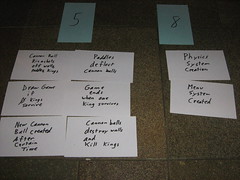
You’ll note that the numbering isn’t sequential. When you’re trying to decide the relative difficulty of a story compared to other stories, what does it mean to be a 5 versus a 4 or 6? If you are measuring difficulty based on estimated number of hours, then sequential numbers make more sense. Using the Fibonacci sequence, it makes it very clear how a story’s estimated cost compares to another’s. You might choose a different sequence entirely.
The last thing the developers need to estimate is how much they think they can do as a team in an iteration. Let’s say that each iteration in this project is one week, which means there are 12 iterations over the course of three months. Now, what’s important to understand is that the estimate is not divided among the development team members. Doing 10 points in an iteration with two developers doesn’t mean each developer does 5 points, and adding a third developer doesn’t necessarily mean you can expect 15 points of work in a week. The estimation is a team effort. It’s not an important distinction when you work alone like I do, but with multiple team members, you can’t treat them as if they are replaceable cogs in a machine.
What the developers usually do is grab a sample iteration from the full collection of cards. They’ll put stories together that sound doable in an iteration, and then they sum the scores on those cards. The total is the estimated iteration velocity. For this example, let’s say the developers think they can do 10 points of work in a week.
Prioritizing Iteration Requirements
Now the developers get out of the way, and the stakeholders get to play. Armed with the collection of story cards, their scores, and the iteration velocity estimate, the stakeholders start putting together iterations according to what they want to see finished first. Again, stakeholders are in charge of the value assessment, so while developers can provide input (“Er, you can’t have the Foo until the BarWidget subsystem is ready, so the BarWidget subsystem needs to be in this iteration if you want the Foo as well.”), the stakeholders get the last word on what story goes into what iteration.
Each iteration has only as many story points as the iteration velocity at most. The developers have already indicated what they think they can do in an iteration, and the stakeholders have to respect the estimate. They can’t expect more work to be done in the same amount of time. Expecting crunch time or assuming that the developers are padding the estimates isn’t sustainable or healthy.
It’s usually at this point that the producer gets heavily involved. If sound assets are going to be ready in a month, for example, then it would be nice if the game was capable of playing sounds within four iterations. Plan those iterations accordingly.
Also, is it all possible? 12 iterations at an iteration velocity of 10 points means that at the end of three months there will be 120 points worth of work possibly finished. According to the example project’s scoring, there are 190 points estimated in the backlog (and you’ll note important things are missing, such as sound and animation work, so there should be more cards, but as this is just an example, I’m not going through all the effort).
Does this mean that the developers need to try to do more per iteration? Should the estimated velocity be changed from 10 to 16?
No! It means that the stakeholders need to make some decisions. Is it more important to hit their ship date, or do they want to have everything in the project plan finished before shipping? Can they be happy with shipping only on desktop computers and not porting to Facebook or mobile platforms? Is multi-ball a must-have feature? In this example, a lot of the estimated hard work was in packaging for builds, but in a real project, there could be all sorts of wishlist items, feature creep, and legitimately important requirements reflected in the story cards. It’s up to the stakeholders to put together the iterations according to their priorities. After all, what those priorities should be is their domain of expertise.
While all of the iterations could be planned up front, the plan can change depending on the progress of individual iterations. It might not be worth the work to plan more than the next iteration or two. I usually have the current iteration planned and the remaining backlog somewhere nearby the cork boards to easily look through if I feel like it.
Development Time
It’s time to get those developers working! During Iterations 1 through 12, the current iteration’s cards can be put in a highly-visible place. An iteration meeting usually ends a previous iteration and kicks off the next one. Stakeholders and developers meet, talk about the previous iteration’s progress, and introduce the next iteration.
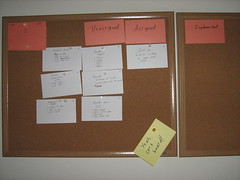
Above is an example of the first iteration of LD18’s Stop That Hero!. I had colored index cards to label a number of columns, and since I worked alone, I left a few out, but here are the different column label explanations:
- Approved (not pictured): Place stories under this label when the stakeholders agree that a story is finished. Again, I work alone, so when I say something is finished as a developer, who would disagree?
- Implemented: When a story is considered finished by the developer, the story goes here and awaits approval from the stakeholder.
- Assigned: This column is for each story actively being worked upon by the developers.
- Unassigned: This column is for all stories in the iteration that aren’t approved, implemented, or are actively being worked upon. At the start of an iteration, all of the iteration’s stories go here.
- Blocked (not pictured): If a developer cannot implement a story, whether due to an unforeseen technical issue or waiting for an external resource, the associated card goes under here. Since I work alone, blocked stories are just stories with requirements or dependencies I haven’t planned for, usually. I just consider it part of the work, so it’s not really blocked if I’m the one doing the unblocking.
While stakeholders determine what stories are in a particular iteration, developers get to choose which story in the iteration to work on at any given time. The developer, or developers if the team makes use of pair-programming, will pick a card from the Unassigned column and move it to the Assigned column. It indicates to stakeholders and other developers that this story is actively being implemented. When a story is finished, the card gets moved to the Implemented column. If the developer finds that there is some obstacle preventing the completion of a story, the card is moved to the Blocked section, and the developer picks an Unassigned story to work on in the meantime.
At a glance, anyone can see the Big Board and know what the iteration looks like. If it’s the beginning of the iteration, it’s not very alarming if no cards are in the Implemented column. If the iteration is almost over and there are still no implemented stories, you know that something is wrong.
In development, sometimes you don’t realize the true nature of a requirement until you start working on it. Maybe a story that made sense in Iteration 0 now seems too vague. Perhaps there are details missing that require a decision from the game designer. Or perhaps a completely new requirement is conceived, and the stakeholders really want it. Whatever it is, requirements change.
What’s nice about using index cards to represent project requirements and user stories is how easy they are to move, create, and destroy. Is there a need for a new user story? Pull out a new index card and write it! Is there a user story that encompasses too much? Split it up by creating multiple stories and ripping up the original card! Is a feature in a later iteration suddenly more important for the big boss to see sooner? Move the cards between iterations!
Creating new stories and working on them aren’t necessarily done in the same iteration. A new story requires the developers to score it, and this work can be done during the iteration meeting. If work wasn’t completed in the previous iteration, the stakeholders can decide if they still want to see it done in the next iteration or if they can push it off to another one. Those iteration meetings act as milestones and opportunities for project assessment.
Within an iteration, it can be useful for the project team to meet for quick stand-up meetings daily. These aren’t hour long meetings. Each member of the team quickly says what they worked on the day before, what they will do today, and whether or not anything is blocking them. Any further discussion can usually be handled outside of this meeting, allowing non-interested parties to get back to work.
Since I work alone, I don’t have daily stand-ups. My cats don’t usually provide much useful input anyway. I do, however, have iteration “meetings” each week, in which I assess the previous iteration’s progress and put together the next iteration. Since I wear all the hats (my cats don’t wear hats), it’s probably more important for me to be conscious of what needs to be said in this meeting. The developer might just want to get back to work, but the producer is going to want to know why progress is slower than expected, and the president might need to decide if the game can be shipped later and still meet the company’s sales goals. Or maybe things are going very well, and the designer wants to know if a new feature can be added. Without multiple people in those roles, there’s less worry about miscommunication, but there’s more concern that an important business role has been forgotten.
Assessing the Health of the Project
For you chart junkies, this is the fun part. You have lots of data here: estimated iteration velocity, the backlog’s total score, the deadline, the number of points completed in each iteration, and the number of points added during an iteration. What can we do with it?
I’ve found that creating a chart to be incredibly useful for at-a-glance project assessments. Here’s an example showing my current project’s first 7 iterations:
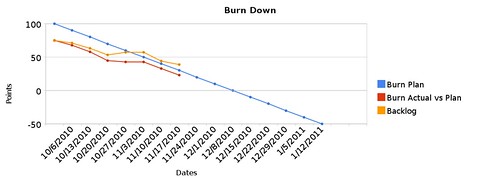
The blue line tells you the ideal plan. Basically, if I have constant iteration velocity from an estimated total project backlog, I can see when I’ll expect the backlog to hit 0 points. In this example, the expected project completion date is December 8th at a velocity of 10 points per week.
The orange line represents the actual backlog. At the beginning of this project, I had identified 75 points worth of stories. If stories are always being completed, you can expect this line to go down, but if work is getting added, it can go up. In this case, the line went up in the 4th iteration, and since nothing was done in the 5th iteration, it stayed horizontal.
The red line represents the amount of work getting completed, or the actual iteration velocities. Except for the 5th iteration, it has been going down at various slopes. The steeper it is, the more work is getting done, and a horizontal line again indicates that nothing was done.
Some people might argue that the orange line is the only one that matters, and it would be if all you cared about was the project being done. However, from a project management standpoint, the orange and red lines don’t mean much unless you compare it to the blue line. Knowing that there is progress is good, but knowing if the progress is good enough is better. The blue line, again, is the ideal, and if you compare the other lines to it, you can get an idea of how healthy the project is.
The red line can also be compared to the orange line. If no work is being added, the slopes will be the same, but if the orange line is more horizontal than the red line, you know that more work was added to the iteration. If the orange line pulls away from the red line too much, it indicates that requirements weren’t identified up front. If either of those lines ends up extremely high compared to the blue line, you know that the project is not on track to meet its deadline.
For example, early in this project, my estimated velocity was 20 points, and it was frankly a guess.

Ignore the fact that the lines extend to the right for so long since it was based on data that wasn’t filled in yet. Still, right away, in the first iteration, you can see that the red and orange lines were above the blue line. The second iteration wasn’t much better. I only did 7 points of work in the first iteration and 10 points in the second. To make it worse, I was adding more stories to the backlog. It took me a few weeks, but I had to face the facts and realize that I wasn’t working as fast as I thought I would.
So I changed my estimated velocity as well as the initial estimated backlog. and as you can see in the earlier chart, things look healthier. But wait a minute! The project isn’t actually healthy! It’s late! Is this just slight-of-hand?
It would if I was trying to deceive, but what I’m trying to do is get as accurate a picture of the project as I can. The project was going to take longer than I originally anticipated, but by getting more accurate data, I could make better decisions. Do I continue the project with the new deadline? Do I cut features to try to get closer to the original deadline? Do I hire contractors to help me speed up development (keeping in mind Brooks’ Law)? Do I cancel the project outright? I decided to continue the project, and I felt confident about getting the game finished before Christmas.
That is, until I realized that there were various aspects of the project I hadn’t given enough thought to. At the end of iteration 7, I created a number of new stories related to glossed over details. Here’s the latest chart:
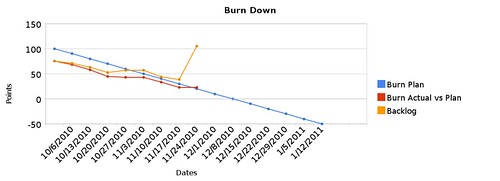
See that spike in the orange line? Yeah, that represents the project nearly doubling in size due to all of the stories I didn’t anticipate originally. Things like a system to let the player choose what level to play in a campaign or a way to save progress. As fundamental as these stories were, I failed to identify them as actual requirements for the project, and so they were never part of the original plan. Even though work is getting done steadily, as the red line demonstrates, the orange line makes it very clear how much trouble the project is in.
Again, it’s way better to have more accurate data than to be happy with flawed data. The project was always in trouble, and now the data reflects this fact. Since I’m an indie without obligations to a sales force or contracts, it’s not as big of a deal to let the deadline slip as it would be if I was working on a multi-million dollar project with sales estimates and stockholders expecting me to meet them. Still, I only have so much in savings, so I’d like to try to get to my first sale sooner rather than later.
The good news is that I expected that spike in the backlog. As I explained in my Stop That Hero! October Challenge post-mortem:
While I knew what tools I would use at a fundamental level, such as which compilers and libraries I would use, I didn’t realize I needed to figure out what technology I needed to create. If I did, I probably would have planned for it in the schedule or I would have pursued a simpler project in the first place.
So I knew there were going to be stories to identify that I missed during my project’s Iteration Zero. I just didn’t expect there to be so much! Hopefully in future projects, I can learn from this experience and try to be a bit more thorough in the technical feasibility assessment. Plus, I’ll have the benefit of this project’s codebase.
Still, the point is that with this kind of Agile planning and this chart, I had an early warning and a rough idea of the project’s health. Without this data, I would have to rely on intuition, and well, let’s just say I don’t have a dartboard.
So how do you create your own chart? I create a spreadsheet with the labels and data indicated below:
![]()
If you click on that image, it’s probably easier to read. The iteration column is just numbered 0 through whatever. The dates column is straightforward. I put the end date of the iteration in each cell.
Under Burn Plan, I have each cell subtract the Estimated Points Completed Each Iteration from the previous amount. So if the estimate is 10 points and the burn plan’s initial value is 200, then the next cell will have 190, and the one below that will be 180, and so on. This column along with the dates will give you your blue line. How do you pick the initial estimated backlog? You can choose a number based on a target date, or you could try to estimate the size of the finished project. My initial number was based on the original estimated velocity of 20 points and an original target date of October 31st. Since then, I’ve tried to use this column’s data to indicate when I can expect to finish my project if i don’t cut features. I’ve had ranges between November and March based on different starting values and estimated velocities. At the start, I didn’t realize how large of a project this game was going to be, but with my latest data and this blue line, I know when I can expect to finish.
Points Completed and Points Added are manually changed each iteration as you complete and add points. Initially, you’re just adding a massive number of points to represent the start of the project with all of the identified work so far.
The Backlog tracks the currently known work, so each cell takes the previous cell’s value, adds the points added to the iteration, and subtracts the points completed in the iteration. This column gives you the orange line.
The Burn Actual vs Plan column will generally subtract the Points Completed in the iteration from the previous cell’s value. So if the first cell is 75 and 3 points were completed in the first iteration, the next cell down would be 72. For this column, you’d ignore the Points Added column. The Burn Actual vs Plan column gives you the red line.
I wish Google Docs let you set the minimum value of each axis. It’s a little annoying to see negative values when the data stays above 0 (seriously, Google, what’s up with that? According to your support forums, this is a highly requested feature). Of course, applications such as Excel and OpenOffice.org’s Calc wouldn’t have this problem, but I like the flexibility of being able to view my burndown chart and data anywhere.
Conclusion
Hopefully this article has given you insight into how I plan my projects and how you can do something similar for your own projects. By using tools as simple as index cards, you can quickly get an idea of the size and scope of your project. Developers and stakeholders can work together from their strengths to create the plan, and by using a simple spreadsheet, you can track the health of that plan.
Once again, I’m not an expert project manager, so I’m doing what I can and am still learning. For instance, while the orange line gives me a lot of useful info compared to the blue line, I don’t know what the red line means when it’s so much further down the chart and starts to go negative. In a few iterations, this burn down chart representing a revised date of February will have a negative red line:
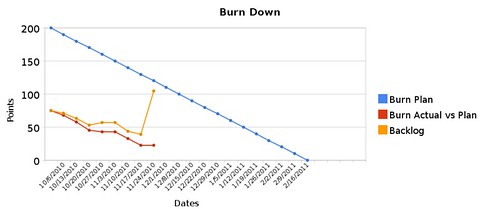
The red line still represents work getting done relative to the backlog, but I wonder if there’s a better way. I’d love to hear any feedback you might have, and feel free to ask questions!
4 replies on “Planning an Indie Agile Project”
Excellent writeup GB! There’s a lot of meat here to process, but until now I’ve only watched the growth of Agile from a real distant standpoint. I’ve seen a lot of corporate projects label themselves as “Agile” and fail miserably. That being said, I wasn’t privy to the project internals so perhaps they were using a bastardized interpretation of Agile..
You managed to put together a clear picture of how the process fits into a development project and given me hope that I can get more Indie stuff completed and launched! Thanks!
Thanks, Erik! There’s a joke that a lot of companies think Agile just means “no documentation” and “no design”. In fact, I think there’s a Dilbert comic about that. B-)
Even if companies take to this kind of planning, other aspects, such as pair programming, are ignored, which is too bad since so many people have found paired programming to actually speed up development and improve quality. “Bastardized” Agile projects are probably more common than they should be.
Nice overview. Scrumworks has a really nice way of tracking burn down, and I wish Pivotal Tracker included this feature. Scrumworks tracks the backlog going down in +Y, and then going in -Y direction it tracks change in scope. So if your backlog increases in size over time due to bad estimation or feature creep, you see bars going in -Y. So the end of your project is the intersection of burn down and change in scope (change in scope ideally being a horizontal line at 0). So if you see bars going in -Y with the same slope as positive Y burn down, the lines are parallel and you’ll never finish.
This is great! I wasn’t expecting such a huge writeup. I work in a decently size large company but I’m in a unique position where I am basically managing my own development. I’ve started incorporating more Agile practices in my work, but really tracking my estimations is something I’m still working on.
This gives me a lot of ideas to play with.
Thanks again!